Asset committees rarely ask whether you can raise rent. They ask whether the asset earns more than it costs to run, and whether management can prove it quarter after quarter. That question lands on net operating income: effective gross income minus operating expenses, before debt service and capital structure.
The operators who grow multifamily NOI without rent hikes treat the property like a set of measurable flows, not a collection of heroic one-off projects. Revenue leaks through unbilled utilities and idle amenity square footage. Expenses drift through auto-renewed contracts and turnover waste. Value shows up in cap-rate math long before it shows up in resident surveys.
This guide is built for that lens: diagnose where NOI is stuck, pick moves that match your asset stage, and tie site operations to numbers asset managers can defend in a lender packet.
Start with a two-minute NOI health check
Before strategy slides, confirm the baseline is honest.
Effective gross income (EGI) starts with scheduled rent, then subtracts vacancy and credit loss, then adds other income: parking, storage, pet fees, utility reimbursements, late fees where permitted, and amenity charges.
Operating expenses include payroll, repairs and maintenance, utilities you cannot bill back, insurance, property taxes, management fees, marketing, and administrative costs. Capital improvements and loan payments sit outside NOI.
Operating expense ratio (OER) divides operating expenses by EGI. For many market-rate multifamily assets, OER often falls between 35% and 50%. Below that range, verify nothing is missing from the expense stack. Above it, the asset may be subsidising inefficiency that rent increases cannot fix forever.
NOI per unit and NOI margin (NOI divided by EGI) let you compare buildings with different unit counts on equal footing. A 200-unit garden-style property and a 90-unit mid-rise can both look “fine” on total NOI while one bleeds per-door economics.
Small moves compound at valuation. At a 6% cap rate, €40,000 of annual NOI improvement adds roughly €667,000 to implied asset value on paper. That is why asset managers track fee income and turnover cost with the same attention leasing teams give face rent.
Gartner human resources research consistently frames workforce and operating decisions around measurable outcomes. Multifamily portfolios benefit from the same discipline: if a line item cannot tie to occupancy, retention, or recoverable cost, it belongs on the review agenda.
Map where NOI leaks before you add new programs
Most underperforming assets do not need a twelfth revenue stream. They need to stop losing money they already earned on paper.
| Leak type | What it looks like on site | What it does to NOI |
|---|---|---|
| Loss-to-lease | Market rents moved; in-place leases lag | EGI below potential without vacancy showing up |
| Turnover drag | 45-day average turn on a 30-day target | Vacancy plus make-ready plus commission eats a rent bump |
| Unbilled utilities | Owner pays water or trash portfolio-wide | Opex grows faster than rent; residents lack usage signal |
| Idle amenity inventory | Coworking lounge empty weekdays; storage closets unrented | Fixed cost with zero offsetting income |
| Fee policy gaps | Guest parking free; second pets unregistered | Other income flat while complaints rise |
| Contract drift | Landscaping scope unchanged after occupancy drop | OER creeps up one renewal at a time |
Walk one stabilized building and one lease-up or renovation wing separately. The right first move on a 94% occupied mid-rise is not the same as on a property still filling floor plates.
Hybrid mobility patterns changed how residents use the asset, not just how they commute. Office for National Statistics data on hybrid working in Great Britain shows how weekday presence varies by role and sector. Garages, package rooms, and flex amenity spaces that assumed five-day routines now need utilisation proof, not gut feel.
Recover revenue the rent roll already implies
“Ancillary income” sounds like a project. On many assets it is closer to accounts receivable cleanup.
Utility recovery (RUBS or submetering). When the owner pays water, gas, or trash for the whole building, NOI absorbs utility inflation residents never see. Ratio utility billing or unit-level metering shifts cost to usage. Implementation needs clear resident communication and lease language; the NOI gain is often immediate on opex, not a future capex bet.
Storage, lockers, and premium units. Closets, bike rooms, and oversized locker banks are rentable inventory. A waiting list for storage while units sit empty is a pricing and marketing gap, not a supply gap.
Pet and vehicle policy enforcement. Pet rent only works when registration matches reality. Second vehicles parked on guest rows without permits undermine both fee income and resident trust.
Amenity monetisation without nickel-and-diming. Reserved fitness slots, guest suite nights, or coworking desk hours can produce income when booking is self-service and rules are published. The failure mode is a locked room with a sign-up sheet nobody checks.
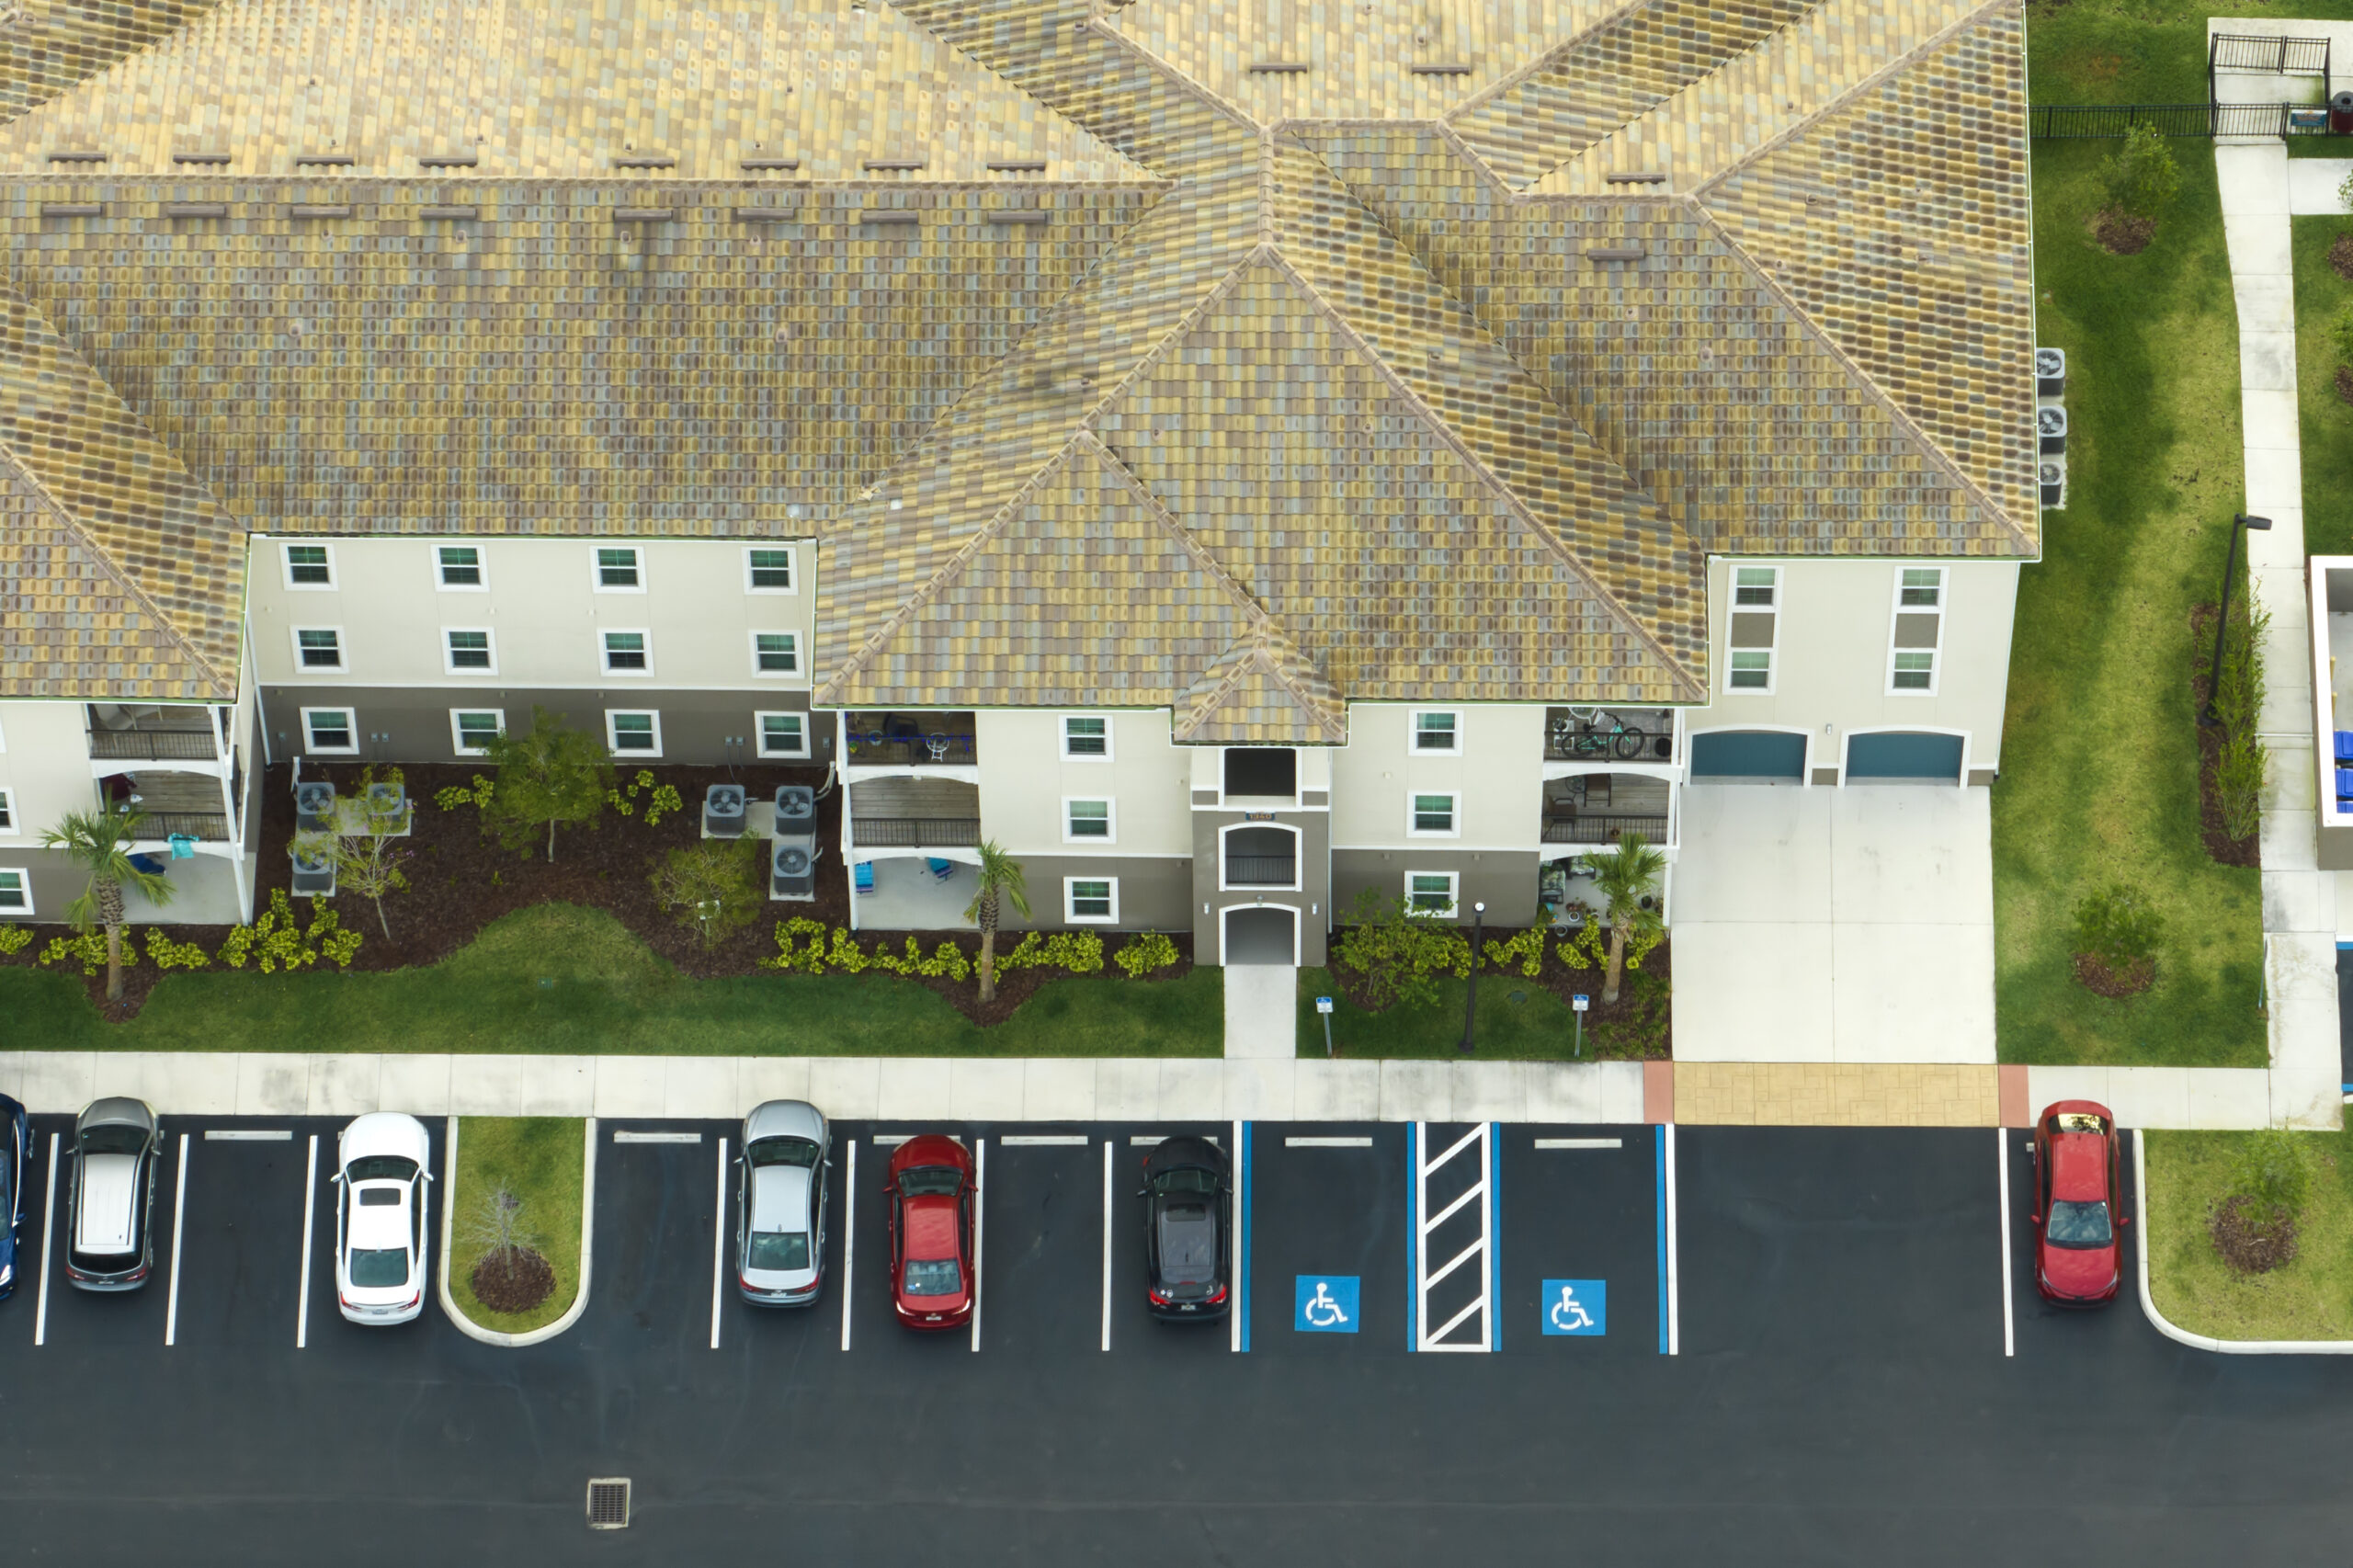
Parking as one P&L line, not the whole story. Garages matter, but this article is not a rate card exercise. If parking policy is the bottleneck, treat it as its own workstream with cost-floor math and tier design documented separately. Site teams still need occupancy evidence when garage fees support NOI targets; that is where operational data and fair allocation rules meet asset reporting.
Model retention as arithmetic, not a marketing slogan
Turnover has a price tag asset managers can calculate:
- Vacancy days between notice and new lease signature
- Make-ready paint, flooring, appliances, and vendor markup
- Leasing cost commissions, concessions, and advertising
- Reputation drag on online ratings when move-outs cluster
Suppose a unit turns in 35 days with €2,800 in combined vacancy loss and make-ready, once every 18 months. That is roughly €1,870 per year of hidden NOI pressure per unit. Saving one renewal at flat rent often beats signing a new lease at €75 higher per month once turn economics are included.
Retention improves when friction drops on the things residents touch weekly: maintenance response, fee transparency, package pickup, guest rules, and amenity access that works on mobile. Satisfaction surveys rarely mention “NOI.” They mention the garage gate that fails every rainstorm and the guest who parked in their paid row all weekend.
Our analysis of visitor parking and first impressions shows how operational chaos at the curb erodes renewal intent faster than a modest fee adjustment. Fix the experience before you argue about the fee.
Tighten expense lines that renew themselves
Expense discipline is unglamorous and durable. The wins residents never notice:
Insurance and risk review. Annual policy comparison with updated loss history, deductible trade-offs, and portfolio bundling. Multifamily insurance markets remain volatile; passive renewal is an OER problem.
Vendor scope tied to occupancy. Cleaning, landscaping, and security contracts written for full occupancy often run unchanged through renovation wings or seasonal dips. Bring ticket volume and unit count to renegotiation.
Make-ready standardisation. Undefined turn scopes produce variable invoices and longer downtime. Checklists, approved materials, and preferred vendor SLAs shorten turns and stabilise R&M as a percent of EGI.
Bad debt and collections process. Credit loss is an EGI problem dressed as accounting. Early intervention and consistent policy protect NOI without raising rent on paying households.
Administrative duplication. When parking permits, amenity bookings, and guest lists live in separate spreadsheets, site teams re-enter the same resident data three times. That is payroll buried inside “property management.”
McKinsey future-of-work research tracks how organisations redesign workflows when demand patterns shift. Multifamily operators applying the same lens ask which tasks exist only because systems do not connect.
Spend capex where payback shows up on the NOI line
Not every improvement deserves capital. Asset committees respond to payback periods and risk reduction, not brochure renders.
High-confidence capex: LED common-area retrofits with measured kWh reduction, envelope repairs that prevent emergency water damage, access upgrades that reduce staffing hours, submeter infrastructure that unlocks utility recovery, and safety lighting in garages residents avoid after dark.
Low-confidence capex: Lobby finishes disconnected from retention drivers, amenity builds without booking data, and parking expansion before utilisation analytics prove existing bays are fully monetised.
Use a simple gate: will this project raise EGI, lower opex, or measurably cut turnover cost within a stated horizon? If the answer is “residents will love it,” demand the metric that connects love to lease renewal rate or fee uptake.
Facilities leaders increasingly borrow from workplace practice: treat shared spaces as capacity assets with utilisation targets. IWFM workplace management standards reflect that shift from fixed overhead to measured occupancy. Multifamily amenity decks and flex rooms belong in the same conversation.
Build an operating rhythm asset committees trust
Replace one-off initiatives with a repeatable cadence.
Monthly (property level): EGI vs budget, OER trend, turn days, delinquency, work-order backlog, other-income per occupied unit, and top three resident friction themes from site staff.
Quarterly (portfolio level): Compare NOI margin across assets, rank ancillary lines by growth potential, review contracts renewing in the next two quarters, and document one pilot result with before/after metrics.
Annually: Reconcile insurance, reassess fee schedules against cost inflation, and align capex queue to measured utilisation, not vendor pitches alone.
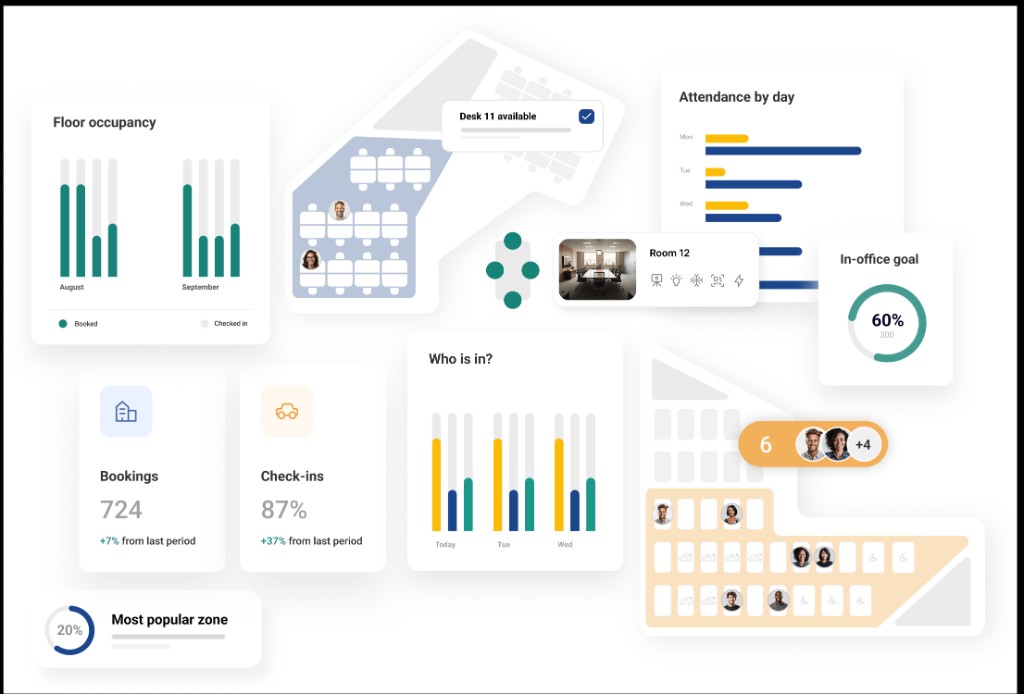
The output is a short KPI pack: charts, not anecdotes. Asset managers who show other income per unit rising while turn days fall tell a cleaner story than those who cite a single rent increase at renewal.
Choose your first move by asset stage
| Asset stage | Likely NOI constraint | Sensible first bet |
|---|---|---|
| Lease-up | Vacancy drag, concession burn | Turn-time standardisation plus fee menu published at move-in |
| Stabilized (90%+ occupied) | Loss-to-lease, weak other income | Utility recovery audit plus storage and pet fee enforcement |
| Value-add renovation | Opex spike, mixed occupancy | Vendor scope reset plus pilot amenity booking on completed wing |
| Older stock, high OER | R&M and utilities | Preventive maintenance program plus insurance and tax appeal review |
Two assets in the same REIT rarely share the same first move. The matrix above beats a generic “ten tips” list because it forces context before action.
How Ronspot supports NOI without becoming your PMS
Ronspot is not a lease accounting platform or a general property management system. It sits where daily resident friction meets recoverable income and occupancy proof: parking allocation, guest access, booking rules, and utilisation exports for assets that run structured garages, flex amenities, or mixed staff and resident inventory.
That matters for NOI because those site-level fights show up as fee leakage, turnover noise, and admin hours that never appear on a capex slide.
When garages, flex desks, and meeting rooms each use a different process, regional teams cannot roll up utilisation. Ronspot centralises booking, release rules, and group permissions so asset managers see fill patterns instead of collecting screenshots from site managers.
The Ronspot admin panel guide walks through how operators configure zones, permit batches, and exports without developer tickets.
Fair allocation that protects fee income
Residents tolerate ancillary fees when allocation feels predictable. When prime inventory is scarce, priority and credit rules spread access without hallway politics. Our post on desk and parking booking priorities describes rule patterns that translate to residential garages and flex amenity peaks: caps on high-demand days, anchor rules, and group-based access.
Feature depth procurement teams can benchmark
Multifamily operators evaluating workplace-style booking tools often compare point solutions on checklists that miss guest flows, auto-release, and portfolio reporting. The must-have parking management features framework gives asset and IT stakeholders a neutral rubric: mobile booking, guest registration, rule engines, occupancy exports, and security posture.
For side-by-side vendor context, Parkalot vs Ronspot lays out where all-in-one allocation platforms differ on fairness rules and admin depth.
Occupancy signals beyond the garage gate
Some mixed-use and build-to-rent assets pair parking data with broader presence patterns. Wi-Fi check-in and attendance tracking illustrates how workplaces correlate utilisation across resources; multifamily teams with staff desks, contractor bays, or coworking wings can use similar signals when amenity ROI is on the committee agenda.
Procurement reviews without a six-month bake-off
Ancillary income attracts scrutiny when records are informal. Fee disputes and tow decisions need timestamped registration data, not front-desk memory. When regional teams compare workplace booking platforms, side-by-side evaluations slow decisions that site staff feel every week. Deskare vs Ronspot maps how allocation depth, guest flows, and admin reporting differ so asset and IT stakeholders can shorten vendor review without skipping due diligence.
Where Ronspot sits in the stack
Ronspot complements property management, access control, and accounting systems. It replaces the manual corner where permits, guest lists, and utilisation reports diverge. Mixed-use operators reduce vendor sprawl when resident parking and workplace inventory share one rules engine under regional oversight.
Book a demo to see utilisation reporting, guest registration, and booking rules mapped to your site plan.
Frequently Asked Questions
What is a healthy operating expense ratio for multifamily?
There is no single answer across markets and asset classes, but many market-rate properties run between 35% and 50% OER. Compare against your own portfolio history and submarket peers. A sudden OER drop may mean missing expenses, not superior management.
Can NOI improve if market rent growth is capped?
Yes. Utility recovery, storage and pet fees, faster turns, lower insurance through structured review, and reduced admin drag all move NOI without changing base rent. The mix depends on asset stage and lease constraints.
How do asset managers prioritize NOI projects?
Rank by estimated annual NOI impact, implementation cost, resident sensitivity, and time to result. Quick wins with low capital intensity (fee enforcement, contract renegotiation, utility billing) often precede major capex.
Does improving amenities always increase NOI?
Only when utilisation and willingness to pay are measured. An empty flex room is a cost center. Booking data, fee uptake, and renewal correlation should justify amenity spend.
Is parking software necessary for NOI growth?
Not always. Small assets with simple surface lots may run fine on clear policy and consistent enforcement. Software pays off when inventory is scarce, guest conflict is frequent, multiple buildings need portfolio reporting, or fee income is material enough to defend with data.
How does Ronspot differ from a property management system?
Property management systems handle leases, accounting, and work orders. Ronspot handles allocation, booking, guest flows, and occupancy analytics for shared physical resources. The systems integrate at the operational layer; Ronspot does not replace your PMS.